To transform the concept of Product-Market Fit from an interesting idea into a useful tool for innovation strategy, we need to be able to quantify it. We need to put the “Q” in Q-PMF.
Q-PMF is a numerical measure of the overall purchase propensity of customers in a specific market segment towards a particular product. Or less formally, it is a measure of customer satisfaction. We’ve designed a model that is easy to use and and always produces a Q-PMF score that ranges from 0% to 100%. You don’t have to understand the exactly how the math works to be able to use Q-PMF effectively, but if you are curious, read on.
Quantifying the Customer Value Model
As we have seen, a Customer Value Model consists of a set of Value Dimensions. In Q-PMF, we express the importance of each dimension as a number from 0 to 100. This is called the Weight of the Dimension, and it indicates how much impact that dimension has on purchase behavior.
How this value is determined varies based on what data is available. If real data regarding customer purchase drivers is available, you should use it. The more accurate the Customer Value Model, the more effectively you can build profitable innovation strategies. Having an accurate customer data model is the quantification of “knowing the customer.” A common cause of innovation failures is a faulty Customer Value Model — the innovators thought they knew what the customers wanted, but they were wrong.
Use this guide as a rule of thumb for quantifying the Value Dimensions in your Customer Value Model:
| Value Dimension Weight | Importance in Purchase Behavior |
| 0 | Irrelevant. This dimension has no value to customers. |
| 1 – 30 | Not very important. Has a small impact on buying decisions. Performance in this dimension is unlikely to drive purchase behavior unless two products are in very close neck-and-neck competition. |
| 30 – 60 | Moderate importance. |
| 70 – 100 | High importance. These are the value dimensions that will have the greatest impact on purchase behavior. |
For the purposes of calculating the overall Q-PMF score of a product, the raw value weight of each Value Dimension is converted into a percentage weight, with the total of all the Dimensions adding up to 100%. This makes things easier because as you make changes to value model by changing weights or adding new dimensions, the model recalculates the weight percentages automatically.
So for example, a Customer Value Model might look like this:
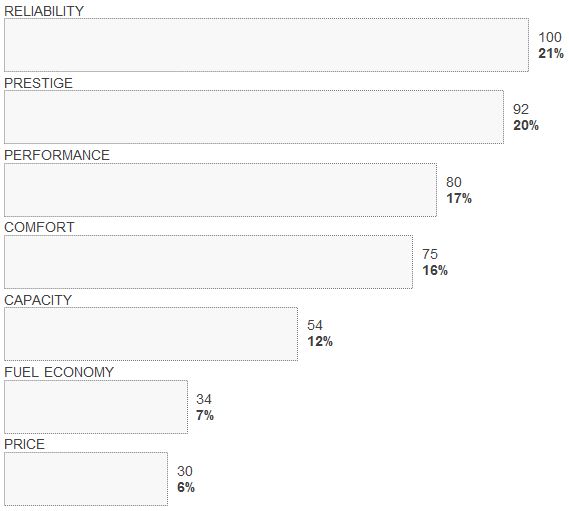
In this Customer Value Model, RELIABILITY is the most important Value Dimension, with a score of 100. But because there are several other high-scoring Value Dimensions, RELIABILITY makes up only 21% of the overall purchase decision for customers ((I can hear some of you objecting with a shout of, “Hang on a second – what about so-called “table stakes” features? Aren’t some features so important that poor performance dooms a product no matter how well it does in other dimensions?” Yes. See Table Stakes & Over Fit. )).
Quantifying Product Performance
Once the Customer Value Model is quantified, the next step is to quantify how well a particular product performs in relation to the model. In other words, how good is the fit?
Remember that “performance” means “impact on purchase behavior,” or less formally, “satisfaction.” The more satisfied customers are with a product in Value Dimension, the higher the performance score. Product Performance ranges from 0% to 100% in each Value Dimension, and is shown graphically like this:
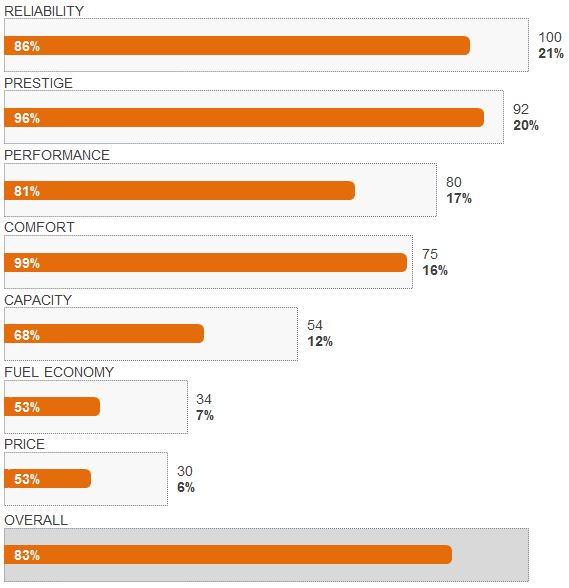
The product represented by the orange bars has an overall Q-PMF of 83%. You can see the choices that the product team made by looking at this chart. They put very high emphasis on PRESTIGE and COMFORT, and also made sure to satisfy customers in RELIABILITY and PERFORMANCE. They put lower priority on FUEL ECONOMY and PRICE ((A common question we get is: “What does a high score on price mean? Does it mean a high price or a low price?” A high score means a positive impact on customer purchase behavior. In most cases, customers prefer a lower price, and are more likely to buy if the price is lower. But here are exceptions. High prices are sometimes valued by customers of luxury goods, and a price that is too low can raise suspicion and negatively impact buying behavior.)); but so do the customers. These customers are not especially price sensitive, and price makes up only 6% of the purchase decision.
So what should we think about that Q-PMF score of 83%? Is that good? Is that bad? The answer is, it depends. And what it depends on is competition, as we will see in the next section: ΔV (Delta V) and the Innovator’s Secret Formula.
NEXT: ΔV (Delta V) and the Innovator’s Secret Formula