In general, the market share that a product receives is directly related to its ΔV vs. competitive options in that market segment. If the company can innovate in ways that increase ΔV, market share will increase. If its ΔV drops due to improvements in competitive products, changes in customer attitudes, or the company’s own mistakes, market share will decrease.
But, there are exceptions to this rule. One of the most important is Table Stakes.
Table Stakes
The term “Table Stakes” is commonly used by product managers to refer to a minimum requirement that a product has to have to be viable in the market ((When I first learned this term as a young product manager, I found it to be confusing. In theory it comes from poker, but the actual meaning of the term in poker and the way it is used in product management are not analogous. Buy-in would have been a better term. But it’s part of the lingo now, so we’ll use it.)). For example, battery life is an important value dimension in mobile phones. It may not be as important to most buyers as other factors, but no one is going to buy a phone with a battery life of, to use an extreme example, five seconds. It doesn’t matter how great your app store is, how perfect your call quality is, or how many megapixels your camera sports if the phone goes dead in seconds. Even though your overall ΔV may be theoretically awesome, you are going to get 0% market share.
To dig into how this works, let’s look again at the Q-PMF diagram we used to explain ΔV in ΔV (Delta V) and the Innovator’s Secret Formula:
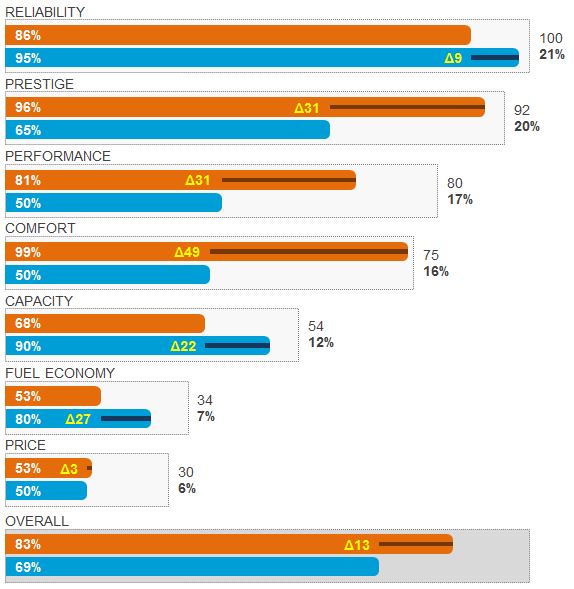
In all Q-PMF diagrams, the left-most point in every bar represents zero customer satisfaction. Here’s how we represent a product that has zero satisfaction in a Table Stakes dimension:
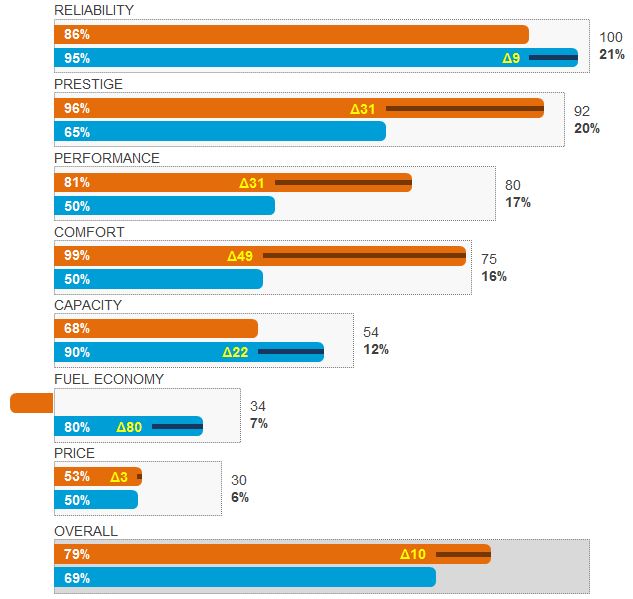
This diagram shows that the FUEL ECONOMY for the Orange product is less than the table stakes value: the minimum value that customers will accept. Perhaps for this market segment the number is 10 MPG. Whatever it is, if you go below it you are going to get a market share of 0% or very close to 0%.
Because FUEL ECONOMY is not a very important Value Dimension for the market segment that is modeled by this diagram, Orange’s satisfaction dropping to 0% does not have a huge impact on the calculated overall ΔV; it drops from 13 to 10. But because FUEL ECONOMY is a dimension with a Table Stakes minimum, and Orange has dropped below it, Orange is not going to get any market share.
Not all Value Dimensions have a Table Stakes minimum. For example, PRESTIGE would not normally have a minimum. Even in a market category where PRESTIGE is an important value dimension there are usually some buyers who would purchase a product that offered no prestige if their satisfaction in other dimensions was high enough.
Knowing what’s Table Stakes and what isn’t is critically important in innovation strategy. And its not just important to make sure you meet Table Stakes requirements — it can be just as important to not over-invest in features that are not critical to your product strategy. For example, the first iPhones were terrible as phones – the AT&T network was full of holes. In my office in downtown San Francisco, people had to go out of the building and onto the street to have a chance of successfully connecting and completing a call. The first version of iOS was also missing critical features, such as cut-and-paste. Part of Apple’s genius was realizing that these were NOT Table Stakes features. People were not happy that the network coverage was lousy and that their mobile email devices had no cut-and-paste, but they lived with it, for a while, in exchange for the benefits that the iPhone delivered. ((Apple’s decision to release the iPhone without cut-and-paste impressed me as one of the most brilliant product management moves ever. The outrage about it was intense. When Apple finally added cut-and-paste, Gizmodo said “After about 10,000,000 requests, Apple has finally given in and delivered the super-basic feature that the iPhone has been missing since day 1: cut and paste. Took you jerks long enough.” But did it stop people from buying? No, it did not.))
Over Fit
The opposite of Table-Stakes is Over Fit. The right-most point in any bar in a Q-PMF diagram represents 100% customer satisfaction. That is, after that point further product improvements in that dimension will not have any impact on customer purchase behavior. We represent over-fit like this:
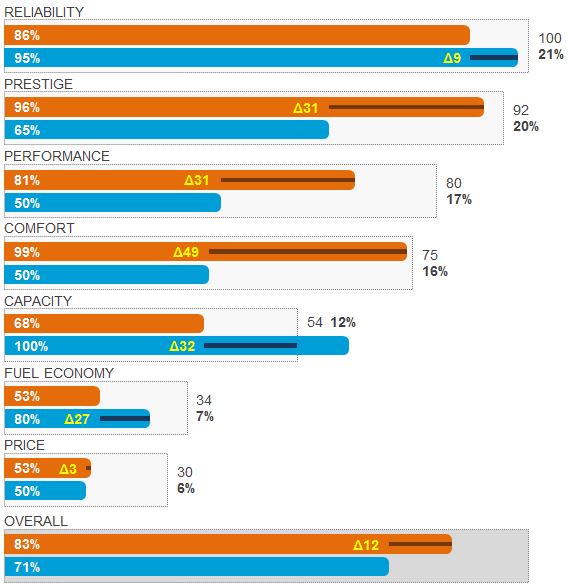
This diagram indicates that Blue has CAPACITY in excess of the amount needed to create 100% satisfaction in this customer segment. So it does not gain any benefit in terms of purchase behavior or market share by adding more. Maybe once you can fit 6 people comfortably, adding room for more does not have any value to these customers.
If you go too far in a dimension that is subject to Over Fit it can become a liability. Modest Over Fit is not usually harmful in itself, other than as a waste of resources that could have been used to increase satisfaction in other dimensions. But in some cases, it can become a liability. Having cup holders in your car is convenient, but having 100 might be annoying. In this case, the Over Fit will result in decreased satisfaction.
NEXT: Lock Out is Out, Lock In is In
Unlike the “Lock-in” page, this page has navigation (which takes it to Lock-in). This may be an indication that it would be worth looking at your overall navigation structure. Overall I’ve been liking the flow of hitting the ‘next’ button, but now that I’ve digressed, I’m not sure if I’m missing something.
Thanks! Fixed.