If there’s a big market for your product, you are going to have competition. So your absolute Q-PMF is not as important as your relative Q-PMF; that is, how does your product compare to your customers’ other options? If you understand this in detail, you can answer many critical questions that guide innovation strategy, such as:
- How much market share should I expect?
- What are my competitive weaknesses?
- What are my competitive strengths?
- What kinds of innovations will have the greatest market share impact?
- What innovations by my competitors would be most harmful to my market position?
- What is my risk of disruption from unknown new competitors?
- Can I achieve customer lock-in?
Introducing ∆V (Delta-V)
∆V (Delta-V, or “Difference in Value”) is a numeric measure of the competitive advantage of one product over another. It is a measure of how much customers prefer one product to another.
To explain, let’s look at an example. In the previous chapter we calculated the overall Q-PMF for an imaginary product to be 83%. Then we asked the question: is that good? Is it bad? To find out, we need to compare it to a competitor, like this:
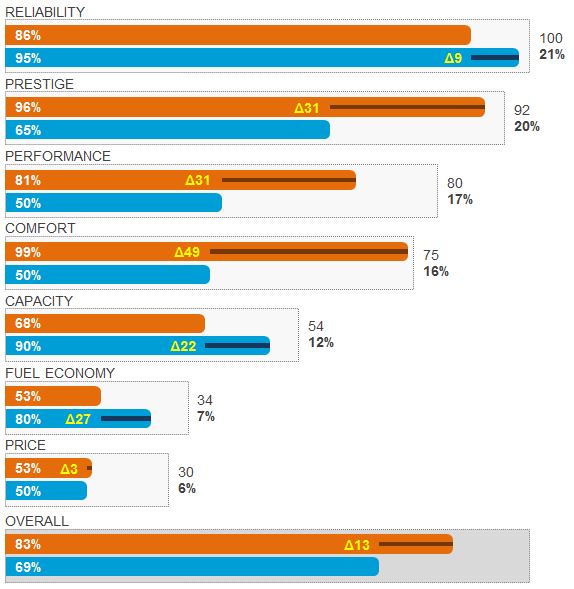
There’s a lot of information here. The bottom line is that Orange has an overall ∆V of 13%. So its Q-PMF Score of 83% is good enough to make customers prefer it over the Blue product.
The diagram also explains how these two products are competing with each other. Orange has emphasized PRESTIGE, PERFORMANCE, and COMFORT. Blue’s strengths are RELIABILITY, CAPACITY, and FUEL ECONOMY.
BLUE has the edge in the most important Value Dimension (RELIABILITY), but Orange’s advantages in the next three dimensions are large enough to make Orange the overall winner.
We can also see that Oranges’s score in the PRESTIGE value dimension is very high: 96%. This is close to the maximum, meaning that it would be almost impossible for customers to feel that any other car is more prestigious. The diagram doesn’t tell us how orange got there (maybe an amazing ad campaign?) but whatever they did, it worked.
There’s a lot more here. We’ll dig into all the ways that companies can use a deep understanding of their ∆V position to improve innovation strategy, but for now let’s explain how ∆V is calculated.
Calculating ∆V: The Innovator’s Secret Formula
Now it is time to unveil the the Secret Formula of Profitable Innovation. Drum roll please!
Where:


![\Delta V = \Sigma[(P_{x}-P_{y}) \cdot W_{n}]](http://s0.wp.com/latex.php?latex=%5CDelta+V+%3D+%5CSigma%5B%28P_%7Bx%7D-P_%7By%7D%29+%5Ccdot+W_%7Bn%7D%5D&bg=ffffff&fg=000&s=4&c=20201002)
All this says is: “The overall preference that customers have for one product over an other is equal to the sum of all the things they like and don’t like about the product, multiplied by how important they think those things are.”
Here’s how it is done. First ∆V is calculated for each individual Value Dimension. For example in the graphic above you can see that Blue has a ∆V of 9 in the RELIABILITY dimensions, since it’s Q-PMF score of 95% is 9 higher than Orange’s score of 86%.
Then to determine the overall ∆V, the ∆V for each value dimension is multiplied by the weight of that value dimension, and then these are added together.
That’s it! It is so simple, it is almost trivial. And clearly we’re winking when we call it a “secret” – it is a secret that everyone knows intuitively. But by breaking it down this way and making it quantifiable, this idea gives innovators a lens through which to view innovation and disruption that wipes away the confusion and enables understanding. Knowing the ∆V measure in terms of both specific Value Dimensions as well as overall product preference is central to understanding and developing an effective Innovation Strategy.
∆V and Market Share
∆V is a measure of competitive advantage, so it is often the most significant driver of market share (although there are interesting exceptions – read about Lock-In and Table Stakes for two examples). In general, Delta-V can be used to approximate how much relative market share competitive products should capture.
For example, in the diagram above Blue has an overall Q-PMF score of 69% and Orange has a score of 83%. Absent external market barriers (such as geography or regulations) and assuming there are no significant Lock-In or Table Stakes effects, the portion of the market that these two products capture will be divided roughly 54% Orange and 46% Blue.
If a product has no competitive advantage (Delta-V) in any dimension (i.e. no positive differentiation) then there should be no expectation of holding any market share over time. The more efficient and dynamic a market is the faster it will convert to the highest value product.
Putting the Tools to Work
The past three chapters introduced the basic concepts of Product-Market Fit, Q-PMF, and Delta-V. Now it’s time to put these ideas to work in understanding innovation and developing profitable innovation strategies.
NEXT: The Innovator’s Toolkit